
What changed for real businesses
Every result below started the same way.
Somebody was doing a job by hand because that's how it had always been done.
3 days/month became
10 min/month
Before: At commZoom, a broadband company I co-founded, our accounting manager spent 3 days typing a 3,000-line journal entry by hand every month-end close. The numbers came from a 150-page PDF billing system report.
What we did: Built a custom data conversion and import tool that reads the billing report and posts the entry to QuickBooks.
After: 10 min/month. She got 14% of her month back.


Answers from hundreds of videos, without watching them
Before: A library of hundreds of YouTube videos with no way to search what was said in them.
What we did: Used an AI coding tool to build an app that saves each video's transcript, tags each speaker and uses AI to summarize each video and answer questions across all of them.
After: Ask a question, search a phrase or a quote in a particular speaker's voice and get an answer, with a time-stamped link to open the video exactly where the answer lives.
A 50-page printed report became one screen
Before: At commZoom, the weekly customer count came out of the billing system as a 50-page printout. You couldn't sort it or filter it.
What we did: Built a dashboard that pulls hundreds of thousands of records into one screen.
After: Pick a date range, a market or a product and see customer growth for any period. No printing.


We could see which TV channels were driving our costs up
Before: At commZoom, the TV networks raised the fees we paid for their channels every year. We had to price each TV package to protect our margins, and we couldn't see which channels were driving the increase.
What we did: Built a Power BI report that breaks the cost down by package, by channel, by type (sports, news, local) and by market.
After: We could price each package to protect our margins, and explain the increase to customers clearly.
"Every year our cable TV programmers and networks raised the fees we paid for their channels. We needed a way to analyze the annual increases not just by cable channel but also by service tiers containing various bundles of channels, so that we could price each tier accordingly to preserve our margins.
The tool that Jake built and published to Power BI allowed me to drill into the various service tiers and individual cable channels to see which were driving most of the cost increases. Development of the tool changed the labor intensity of this process and gave us better visibility to an otherwise unwieldy exercise. It also allowed me to sort and filter by content type (sports, news, local broadcast), by payment type (direct to programmers or through our trade association) and by local market.
This gave me a better understanding of our cost drivers and provided data-driven support for necessary annual price increases and an intelligent way to clearly explain those price increases to subscribers.
At commZoom we had a management philosophy about the practical aspects of running the business. The complexities specific to our industry and markets required that we develop customized tools to get better information more efficiently to serve the specific needs unique to our small business. Custom-built intelligence tools - when combined with carefully considered variables, inputs, costs, and timing sensitivities - evolved to strengthen our capabilities better than off-the-shelf reports or info from our existing software systems."
~ Bob Cohen, former CEO of commZoom
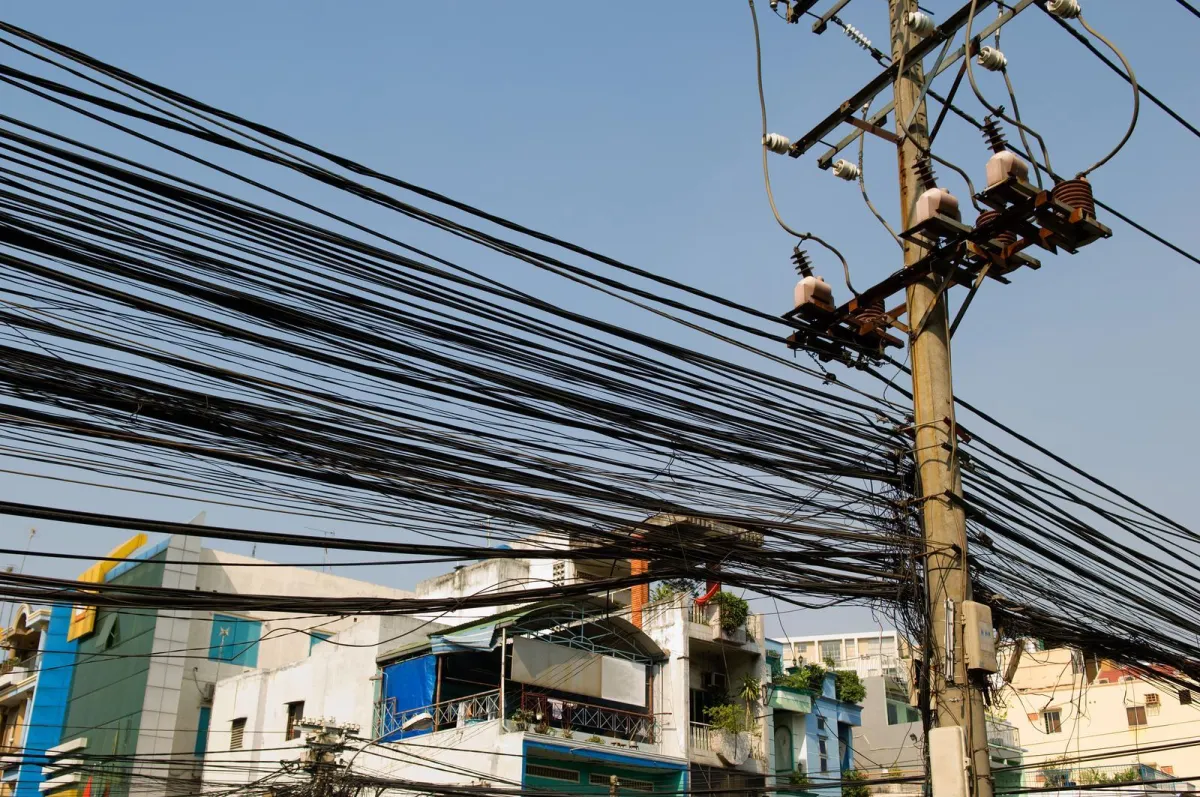
We saw network slowdowns coming before they affected customers
Before: At commZoom, each of our hundreds of fiber circuits could carry only so much traffic. We couldn't see how much each one carried during peak hours, 6pm to 11pm, when customers streamed their shows.
What we did: Built a model and a 3D chart from the network's usage logs. It shows how full each circuit gets, by day of the week and by market.
After: We could see where to add capacity before customers saw buffering.
"As an internet service provider, commZoom had to make sure that we had enough bandwidth to service ISP customers during peak usage periods. This was most critical between 6pm and 11pm, when customers streamed their favorite shows. Each of our hundreds of fiber circuits and nodes could carry only so much downstream traffic to our customers. But we didn’t have good visibility into how much traffic they carried during these peak hours.
We provided Jake with usage logs from our CMTSs [cable modem termination systems] that recorded bandwidth consumption for each circuit. Jake built a custom data model and 3-D chart showing maximum circuit utilization percentages for specific days of the week, in specific nodes, in specific markets. This told us where we would have to add capacity soon to prevent buffering for customers and to reduce strain on our network.
The software that provided the raw data did not help us USE that data. We tried to analyze the raw data, but we couldn’t see patterns clearly. Until we had the circuit utilization model that shaped that same raw data into something we could use and something that prevented us from getting caught with insufficient bandwidth.
I like how this new data model aggregated thousands of data points and cut our analysis time to virtually zero. Once we had the new circuit utilization model, we could see clearly and plan accordingly. And we could use it repeatedly, simply by uploading fresh log data to the model."
~ Jack Gorman, former CTO of commZoom
A hospitality client paid less for workers' comp insurance
Before: The client's payroll records came from two different payroll companies and covered two partial periods. The two sets didn't match: different job titles and workers' comp codes that were missing or didn't line up.
What we did: Cleaned up the records and combined them into one report showing total pay by employee and by workers' comp code.
After: The insurance company's audit used the right numbers, and the client's premium came in lower.

Want to know what's hiding in your business?
Have a question first? Ask me.

Follow Us
Know where AI will save you time and money.
Legal
Contact Us
(888) 705-3697
9211 BROADWAY ST UNIT 171142, SAN ANTONIO TX 78217
TIMELY DECISION DATA™ means the numbers you need, in time to act on them.
© Copyright 2026. Data Make You Smile LLC. All rights reserved.